
Image credit: Michael McLoone-Imagn Images
Three strikes and you’re out. It’s the rare sports cliché that has escaped into the greater American vocabulary not just as a figure of speech, but as sort of a greater truism. In America it’s come to provide the structure of habitual offender laws, YouTube copyright bans, and the corporate policy for any new executive who wants to look tough. Of course, the idea of three being a significant number, and of twice being coincidence, three times a pattern, is far older than baseball. But the national pastime does provide a little divine weight to the number in the U.S., and so it’s stuck, even if three strikes wasn’t always an out.
The mantra includes an unspoken secondary property: If an action isn’t serious enough to rate as one-third of a crime, if it doesn’t wind up rated as a strike, it rounds down to nothing. It’s a write-up that goes into a file, only to be discovered when something really does happen later. There are lots of things you can do just once and get fired; punching your boss, for example. There are also lots of things you can do three times and then get fired, like no-showing for work or damaging equipment. But there aren’t many things you can get away with 19 times, but not 20. Any corporation or government agency that truly wished to enact such a policy would be subjecting themselves to an exhaustive level of record-keeping and statistical analysis. Which is why, as we finally hit our thesis, third base coaches are such inveterate cowards.
Of course they’re cowards; they have every reason to be. For more than a century baseball lived under a system of incentives for its players and coaches that ran separately, and sometimes almost in perpendicularity, to the incentives of winning. Batter strikeouts brought shame in no way proportional to the relative harm they caused over a weak groundout. Sacrifice bunting earned odes in the local paper despite paper-cutting the team to the tune of -0.02 WPA each time. Modern analysis has scrubbed most of this away, if not quite all. And the third-base coach lives in one of the recesses. Few outs are as ugly as one at the plate, and few mistaken holds are remembered by the end of the inning.
We know this. We’ve known this for so, so long. This piece was originally slated to run exactly on the 15th anniversary of a Russell Carleton article entitled “Why All Third-Base Coaches Should Be Fired.” His analysis:
In 2009, there were 97 instances where this sort of situation occurred: no outs, runner on third, fly ball to the outfield. When the runner tried for home, he was safe 96.2 percent of the time (75-for-78). In fact, Perlozzo himself was perfect in 2009: 100 percent of the runners he sent in this situation (and in all sacrifice fly situations) reached home safely.
This seems like a good thing on the surface-but it’s actually not.
A 96-percent success rate means that third-base coaches are being far too conservative-and only sending the sure things. Suppose that after considering the speed of the runner on third, the distance of the fly ball, and the strength of the outfielder’s arm, the third-base coach figures that the runner has an 80 percent chance of scoring. There’s a 1-in-5 chance that he’ll be gunned down, and we already figured out that anything over 73.2 percent is a good bet-so being rational, the runner with the 80 percent chance should make a mad dash for home. If third-base coaches are only willing to send the runners who have a 95 percent chance or better, they’re leaving a good chance at extra money, er, runs on the table.
It’s tough sometimes finding articles when Russell stole them all a decade and a half in advance, but at least we can check in on human progress. Has baseball discovered its spine? In 2024, there were only 52 instances of Russell’s game state: sole runner on third, zero outs, fly ball caught by the outfielder. When the runner tried for home, he was safe… 94.9% of the time (37-for-39). And if you’re tempted by this news into incrementalism, note that it’d be 97% of the time if Jonathan India had considered that newfangled trick all the kids are trying, called “sliding.”
Nothing has changed. In fact, erasing the out and base state restrictions from Russell’s example, we witnessed 1,175 sacrifice fly situations and the third-base coach sent the runner on 920 of them. The result: 892 of the runners scored, and 43 occasions resulted in a double play. If you noticed those two latter figures don’t add up to 920, it’s because more than a third of those twin killings assassinated a trailing runner. If we focus on that guy at third, the final score is: 97%. The states may change, and the calculus behind each individual send can differ. But the average result ends up being the same.
Today we have some tools at our disposal that weren’t available in 2010, thanks to all the expensive cameras MLB likes to plant around the ballpark. We can now estimate, in most cases, exactly where each fly ball lands, both in terms of distance and angle. We can evaluate the strength of the fielder’s arm, using the THR component of their DRP. And through Statcast we can assess each runner’s sprint speed, which bears a bunch of caveats when applied to most baserunning, but provides a workable baseline in a situation where the runner just has to get from third to home as quickly as possible.. These metrics won’t always perfectly translate—as we’ll see, the art of tagging up, fielding and transferring the ball, and applying the tag at the plate all exist outside these numbers. But they work pretty well, as a baseline.
The trouble is that they work pretty well, but as annoyingly dependent variables. The batter, the runner, and the fielder all fit together in the third base coach’s calculus. We’ll start by examining each element separately, and then combine them together. The first, and most important, factor of a sacrifice fly is where that fly lands.
To study this I split the outfield into 80 buckets, eight wide and 10 deep. For depth I used segments of 25 feet, with anything traveling less than 200 feet in the first row, 200-225 feet in the next, and upwards with the final row being balls hit over 400 feet. For angle, I cut the field into 15-degree increments, with a fourth on each side being anything in foul territory. Then, for all sacrifice-eligible fly balls (less than two outs, runner on at least third), I calculated both the attempt and success rates of each zone.

The upper end, it turns out, wasn’t really necessary: beyond 350 feet, a sacrifice is guaranteed. As far as angle goes, since we’ve ruled out line drives, most batted balls in front of the outfielder give them time to settle in, making the difference in attempts and successes negligible, except as the ball approaches the foul line. There, the runner is more likely to be sent and more likely to reach, regardless of which line it is. It’s interesting that in spite of the general reputation of throwing ability between left and right fielders, the attempt rates are nearly equal for both halves of the outfield. Another factor: the catcher has an easier time applying the tag on a throw that’s coming in at a similar angle to the runner, as opposed to having to sweep across from right. We’ll see an example of that later on.
That chart is pretty, but it doesn’t do a very good job of approximating the shape of a baseball field, so here’s a more accurate heat map, crafted by Stephen Sutton-Brown:


The real key to the data here is one particular path of earth: the range of fair territory between 300-275 feet, and from 275-250. In the former range, third-base coaches hold their runners an average of 10% of the time, despite the fact that runners are scoring 19 times out of 20. In the latter, shorter range, coaches throw up the stop sign almost half the time, despite a five-in-six chance of scoring. Of course, we’re ignoring the other variables, and coaches aren’t—maybe they’re holding the runner in the exact right moments, when the runner is slow or the fielder has a cannon. We’ll continue by looking at these elements.
Separating footspeed from batted ball location, we can break down runners in one foot/second increments. Doing so we find the following rates:

Sample size tweaks the colors on the left-hand side, as it’s wont to do; even over a decade, 21 ft/sec runners are pretty rare, so their cautiousness sticks out a little. Otherwise, there’s very little surprising here: Faster runners make more attempts, and largely succeed more often. If there’s any real takeaway, it’s that the drop in success rate is less steep than one might imagine; safety appears to be practiced at all speeds.
Finally, we’ll look at the outfielders.
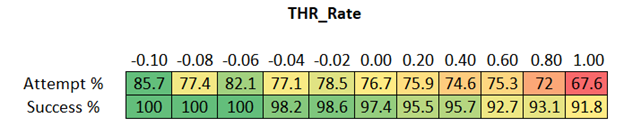
This, too, is pleasantly linear. Coaches know who to test, and who to avoid. It’s worth mentioning that perhaps one reason for the blending between left fielders and right fielders can be seen here: When it comes to sacrifice flies, footwork is every bit as important as arm strength. The great cannons have reputations that precede them, but it’s unlikely that a plus-0.50 arm and a minus-0.2 arm are really that different to the third base coach. What they can tell is whether the fielder has given himself time at the point of catch, has planted his feet, and looks ready to unload. The correlation between range and arm, combining to make some people just good fielders, is probably visible above.
Now that we have our three variables, Sutton-Brown combined them together using a logistic regression to create an expected success rate. For these purposes we used linear terms on THR Rate and sprint speed, given the way that they correlated with success rate in the charts above (and the way that velocity works); any increase or decrease should lead directly to an increase or decrease in the probability of success. For distance, we used what’s known as a spline. This was done to capture the nonlinear effect we see in the plots, where there is nearly no change in success probability above or below some distance threshold.
As is often the case with large-scale data, particularly a sample that reaches back to the early days of Statcast, there are a few batted ball events missing necessary inputs; these were thrown out. Of the 10,699 sacrifice-eligible fly balls hit between 2015 and 2024, we were able to estimate a success rate on 10,103 of them, or 94.4%. Upon inspection, the ineligible data did not demonstrate any pattern in terms of any of the variables, including result, that might have altered the results. We all work with what we have.
***
Given these numbers, we can present some awards. First, there’s the best send that failed. In the bottom of the first on June 8, 2016, Freddy Galvis skied a fly to reasonably deep in left, 317 feet. That’s the 99% success range, and with a relatively lithe Odúbel Herrera tagging up, we rated the chance of success at 99.5%. Albert Almora Jr. was charging, which gave him some extra power but robbed him of accuracy, and his throw was offline. So of course Herrera was a dead duck.
It’s hard to be certain, but it looks like the cause of death was Herrera’s jump. The broadcast denied us a picture-in-picture view for comparison, but the camera cuts from here, with Almora already ready to throw:
An instant later, when the view switches to the runner, he’s taken two steps off the bag.

The best send, in terms of defying the odds, took place on July 23, 2023, when Oscar Colás ranged in to retrieve a shallow fly and promptly fell down, allowing Joey Gallo to lope home and accept his gift. The next one on the list, with an estimated success rate of 31%, came on a perfect throw.
This is a tough play for Mitch Haniger, who has to run all the way to the line, make the grab, flip his body completely around and make a snap throw to the plate. Which he does, perfectly; so perfectly, in fact, that catcher Chris Herrmann has no idea how much time he has to turn and apply the tag. Instead he dives blindly to his left, in front of a chugging Omar Narváez, who has plenty of time to simply dance around the outstretched glove and tag the plate.
Finally, we’ll look at the worst failed send, which might make the least sense. It’s late-career Alex Gordon vs Tyler Naquin, a man who just converted to pitching, so the defense has the upper hand. The ball travels just 247 feet, straight at the right fielder, and the throw beats the runner by multiple steps.
Six or seven, in fact, because just as a pop fly is a hit when it’s just shallow enough, getting beat badly on a throw gives a runner just enough time to be creative. Gordon makes a hell of a play dancing around in and behind both batter’s boxes. He’s only called out on review. It almost makes you wonder what might have happened if… no, never mind.
***
Examples are fun, but baseball is won and lost in the aggregate. With our expected success rate, we can evaluate third base coaches as a whole. Not perfectly, because each game state is individual—down a run with one out in the bottom of the 10th is very different than a scoreless top of the first with no outs. So for now we’ll approximate, and use Russell’s rough benchmark. If the odds are 80% or better, give the green light. Less than that, stop sign.
Above Cutoff
Below Cutoff
Correct Decision
Sacrifices
7397
174
97.7%
Double Plays
164
59
73.5%
Holds
907
1401
60.7%
Holds (250-300 feet)
125
638
16.4%
If a runner heads home on a sacrifice, they were right to do so. There are very few bad sends in general league-wide, fewer than there are teams. More counter-intuitive is the knowledge that when the runner was gunned down, the third-base coach was still probably right to send him. That’s what 80% is supposed to look like. But when the runner holds, that’s where the damage is being done. And when the ball falls in that 250-300 foot range, the failure is almost universal. Multiple times a week on average, an MLB team is holding a runner who could have scored, and a lot of the time, they’re stranding them there.

Teams are tracking this—you can be sure that if this data is here, it’s no secret to major-league front offices. But we’ve largely seen a disconnect between that information and the behavior of the coaches who have long understood how best to stay employed. The shame of the strikeout was only tamed when it was held up to the cold light of analytics, and hitters were given proof that their bosses did appreciate their way of doing business. Coaches, if they’re to operate with the efficiency that has come to mark baseball as a whole, need the same. After all, it’s so easy to scapegoat a coach, especially when their successes are invisible and their failures become highlight reels for a generation. It’s a tough line of work.
Thanks to Robert Au for research assistance, and to Stephen Sutton-Brown for the heat map and predicted success rate metric.
Thank you for reading
This is a free article. If you enjoyed it, consider subscribing to Baseball Prospectus. Subscriptions support ongoing public baseball research and analysis in an increasingly proprietary environment.
Subscribe now


 vs. Cincinnati Reds (2-6)")


